
How do I read the Search Console Performance report?
The Performance report shows how often your site appeared in Google Search (impressions), how often people clicked (clicks), the share of impressions that got a click (CTR) and your average top spot (position). Use the Queries and Pages tabs to see which searches and pages bring visitors, and compare with last year rather than last week.
The short version
- Open Performance, then Search results. The default view is the last three months.
- Four numbers: clicks, impressions, CTR (click-through rate) and average position.
- The Queries tab shows the searches. The Pages tab shows which pages got the clicks.
- Compare with the same period last year to allow for seasons.
- Since 2025 you can split searches for your business name from everything else.
What do the four numbers mean?
Google’s Performance report page defines them:
| Metric | Google’s definition | In plain words |
|---|---|---|
| Clicks | Times a user clicked through to your site from Google Search | Clicks from Google, which usually but not always become visits |
| Impressions | How many times your site appeared in Search results | Times you were shown, seen or not |
| CTR | Clicks divided by impressions | The share of impressions that got a click (not a count of people) |
| Average position | The average position of the topmost result from your site | Roughly where you showed up |
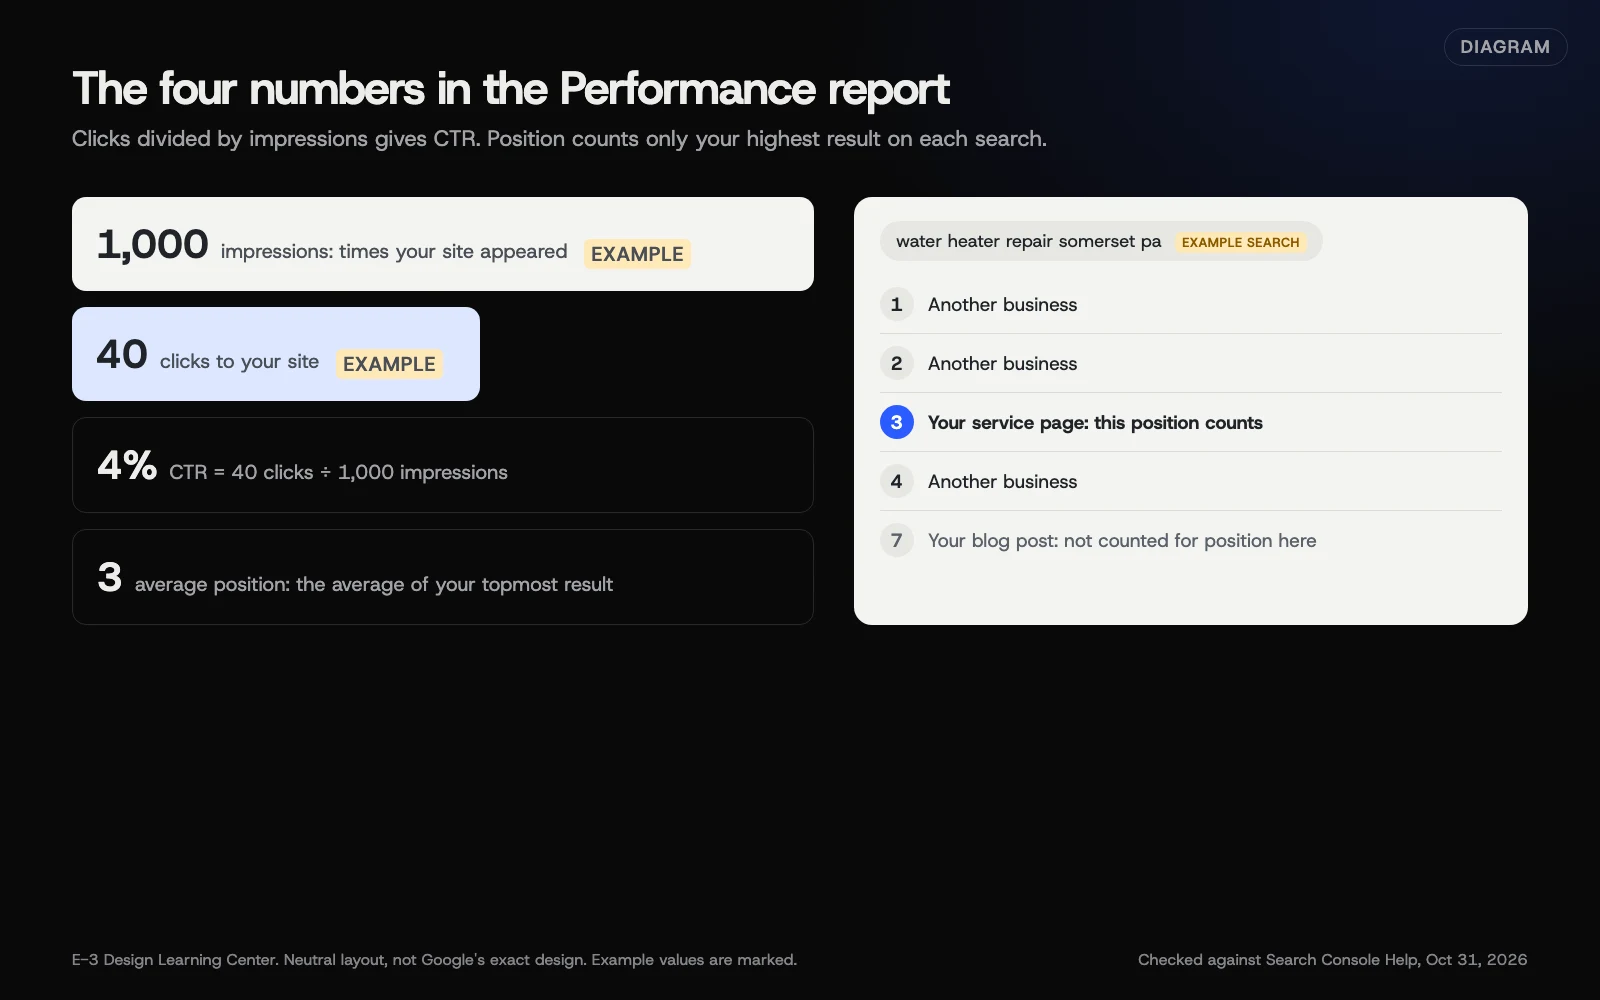 Diagram: how impressions, clicks, CTR and average position relate, with made-up example numbers. Definitions from Search Console Help (October 2026).
Position 1 is the top. Average position mixes every search, place and device, so a page might be third in one town and twentieth in another. Read it as a trend, not a rank.
How do I find my top searches and pages?
These steps follow Google’s common tasks page.
- In Search Console, select Performance, then Search results.
- Select the scorecards at the top to choose which numbers show. Turn on all four.
- Change the date at the top. Last 28 days or Last 3 months suits most checks. The report keeps up to 16 months.
- Below the chart, select the Queries tab. Sort by Clicks to see the searches that bring visits.
- Select the Pages tab to see which pages earn those clicks.
- Select one query to filter the report to it, then open Pages to see which page answers it. It works the other way too: select a page, then open Queries.
The other tabs are Countries, Devices, Search appearance and Dates. Devices is worth a look, because many local searches happen on phones.
Compare with last year
Open the date filter, choose Compare, and pick the same range a year earlier. Sort by the Difference column to see what changed most. Google’s filtering page suggests weekly or monthly views when comparing ranges, which smooths out daily noise.
Split branded and non-branded searches
Searches for your own name show that people already know you. Searches for your services show new customers finding you. Google added a filter for this on November 20, 2025, per its branded filter post:
- Select the filter bar above the chart.
- Choose the Query filter.
- Pick Branded or Non-branded.
Google decides what counts as branded with an AI-assisted system, and says some searches “may occasionally be misidentified.” It’s only for top-level properties with enough searches, and its data starts on March 11, 2025.
What should I look for?
- Searches you didn’t expect. If people find you for a service you barely mention, give it a proper page.
- High impressions, low CTR. A page shown often but rarely clicked may need a clearer title and description. Sort Pages by Impressions, then look at CTR.
- Positions 8 to 20. These pages are close. Better content and a few internal links can move them onto page one. Our answer on how to choose keywords helps you decide which ones to work on.
- A drop on one page. Compare dates, then inspect the page to check it’s still indexed.
To keep track of why numbers moved, add a note on the chart. Google’s annotations post says to right-click the chart, select Add annotation, and write up to 120 characters. Everyone with access to the property sees it, so keep personal details out.
Why does it matter?
This is the only place to see the actual words customers type when Google shows them your site. It tells you which services are being found, which pages earn their keep, and whether your search visibility is growing. For a broader monthly routine, see the complete Search Console guide.
What are the common mistakes?
- Adding up the table. Google’s data page says chart totals can be higher than the table, because tables show up to 1,000 rows and leave out rare searches for privacy.
- Treating today’s data as final. The 24 hours view shows recent hourly data, but the newest numbers are preliminary, shown as a dotted line, and can still change. Judge trends on complete days.
- Chasing average position. A higher position on a search nobody makes is worth nothing. Watch clicks first.
- Expecting these clicks to match Google Analytics. They measure different things. See why GA4 and Search Console numbers don’t match.
- Forgetting the time zone. The report runs on Pacific Time, so days split differently from your own.
What if the report is empty or looks wrong?
- A new property shows little for the first few days. Google says data collection starts when anyone adds the property to Search Console, even before verification, so older history won’t appear.
- A URL-prefix property only shows its own addresses. If clicks seem low, add a Domain property. Our main guide explains the two kinds.
- A sudden fall. Check Manual actions and the Page indexing report, then read our answer on why traffic suddenly drops.
- No branded filter. Your site may not have enough searches yet, or you’re in a sub-property.
How much does it cost, and how long does it take?
The report is free. A useful monthly read takes about 10 minutes: last 28 days against the same period last year, top 10 queries and pages, and anything that moved a lot.
How does E-3 handle this?
Search Console is set up by E-3 for its managed sites, with E-3 as a user, so the Performance report can feed the reporting in our SEO and AI search service: which searches find you, which pages to improve, and what changed. Page changes that follow are made on a staging copy before going live.
Related questions
Sources
- Performance report (Search results): Overview and basic setup (Search Console Help)
- Performance report (Search results): Common tasks and use cases (Search Console Help)
- Performance report (Search results): Advanced filtering and comparison (Search Console Help)
- About Search Console data (Search Console Help)
- Introducing the branded queries filter in Search Console (Google Search Central Blog, November 20, 2025)
- Adding context to your Search Console data with custom annotations (Google Search Central Blog, November 17, 2025)
- Add a website property to Search Console (Search Console Help)
Next step
- Next: How do I use the Core Web Vitals report in Search Console?The next guide in Google Search Console.
- Free website checkPublic checks on your own site, then an action plan of what to fix first.
Still stuck? Ask E-3 for an answer from our help guides.
Rather we handled google search console for you?
It’s part of what we do every week for small businesses, as part of seo and ai search. Start with a free check of your site and profile, or call and ask.